
Connectomics
Alzheimer’s Disease (AD) is a progressive neurologic disorder, that accounts for the majority of dementia cases. The disease affects memory, thinking, and behavior, eventually progressing to a level that interferes with daily tasks. Over 5.8 million Americans are suffering from this disease, and it is projected that in 2050 the number will rise to 13.8 million based on research from the Rush Institute of Healthy Aging. The impact on the population and the toll AD is taking on our healthcare system is growing. Because of this, it is important to develop a method for early diagnosis, ultimately preventing major disease progression. Studies conducted by the Functional Imaging in Neuropsychiatric Disorders (FIND) Laboratory at Stanford University show that functional magnetic resonance imaging (fMRI), which uses blood-oxygen-level-dependent-imaging (BOLD) contrast to correlate the technology with brain activity, can be used to identify the changes in the brain that correspond to the onset of AD. Artificial intelligence methods, if used in tandem with fMRI data, can capture the main features of brain connectivity to accurately highlight the differences between a healthy and AD patient. Combining these two methods has the potential to provide an early disease diagnosis.
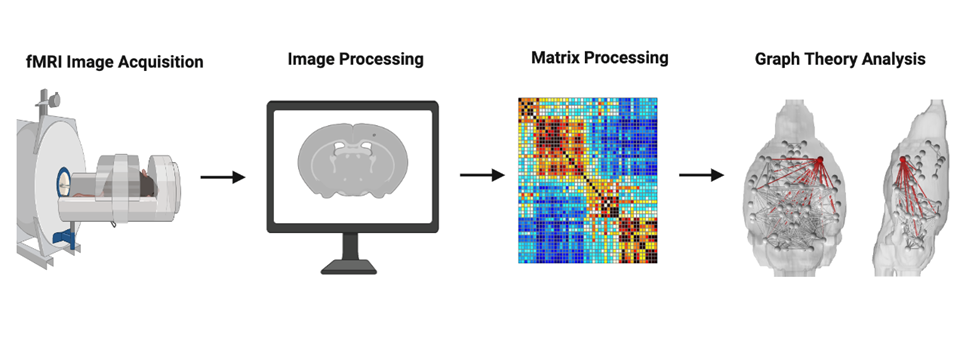
Through advancements in fMRI analysis, a numerical assessment of functional connectivity in human brains is provided. Connectomics is the science that studies the structural and functional connections of an organism’s nervous system. The brain is a highly interconnected network. When there is dysfunction, it can spread across linked elements, shaping the onset, expression, and progression of neurodegenerative diseases. To understand the extent of network disruption and the neuroanatomic structures affected by AD, we use data derived from fMRI to create adjacency matrices, representing networks of nodes and edges. These matrices are then analyzed with the mathematical principles of Graph Theory, which models such systems by denoting brain regions as nodes that are physically connected by edges (links). By extracting different metrics from this graph, we can obtain important organizational information and connectivity patterns of brain networks. For example, by calculating the network behavior when nodes or edges are removed, we can identify the brain regions present in early network degradation. We can use AI algorithms to locate the vulnerable points that cause the brain disorder once these regions are identified.
For more details of our work in this area, please check out our publications and other related works:
Connectomic analysis of Alzheimer’s disease using percolation theory
Neuroscience Next 2020 Abstracts
AI Research Catalyst Fund Awardees Virtual Seminar Series – Parker Kotlarz
Council on Undergraduate Research- Posters on the Hill 2022
Grain Size Characterization
The mechanical, electrical, magnetic, and optical properties of ceramics, metals, and their alloys are microstructure sensitive. Because of this, characterization of microstructures is essential to the understanding and development of materials. Researchers turn to grain size analysis to quantify the average diameter of crystalline regions in polycrystalline samples. However, current analysis standards, like line intercept and planimetric methods developed by ASTM International, require timely, manual input and knowledge of rules and exceptions. The automation of the grain size determination process was previously attempted with edge detection and intensity thresholding in recent studies conducted by researchers from the University of Maribor in Slovenia and Jadavpur University in India. These methods, however, have some key drawbacks. Manual input is often still necessary to connect grain boundaries. Current methods work especially well with specific materials but have not been applied to diverse sets of micrographs. More specifically, a large focus is placed on metallurgical optical images, with little consideration for ceramics.
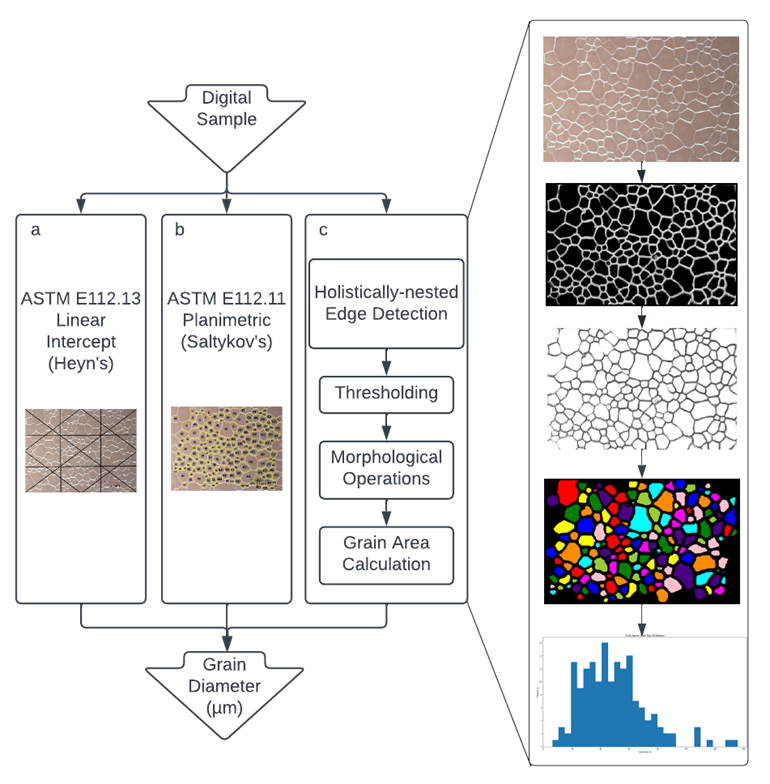
We, in partnership with Nvidia AI Technology Center, have combined the rapidly developing field of machine learning (ML) of artificial intelligence (AI) with microscopy analysis techniques to intuitively determine the average diameter of optical micrographs. The main advantage of AI architectures is that they can relate image features to tangible objects. The BSD500 dataset developed in 2001 by scientists from University of California, Berkeley, which trained the Holistically-Nested Edge Detection (HED) proposed by researchers from University of California, San Diego, is actually composed of natural landscapes. The algorithm benefits from the supervised learning of this dataset to accurately determine the edges of topological features in optical micrographs. The architectures are pretrained; therefore, no additional data is needed by the researcher to use the algorithm. After the edge map is created by HED, thresholding selects the strongest edges. Then, a series of morphological dilations and erosions resize the grain boundary widths which connect any fragmented edges. Finally, the area of each contour is calculated, with the average diameter of the contours relating to the grain size of the material. The new workflow only takes 10.7 ± 0.3 seconds to process per image, much lower than the 217 ± 20 seconds needed for the line intercept method. Moreover, the AI workflow requires minimum input from the researcher: Only an image and scaling ratio is needed.
We are in the process of getting a paper published in this area. Our paper titled “Deep Learning Workflow for Microstructure Analysis and Quantification” was submitted to Molecules Journal in June 2022.